 1
2
3
4
5
1
2
3
4
5
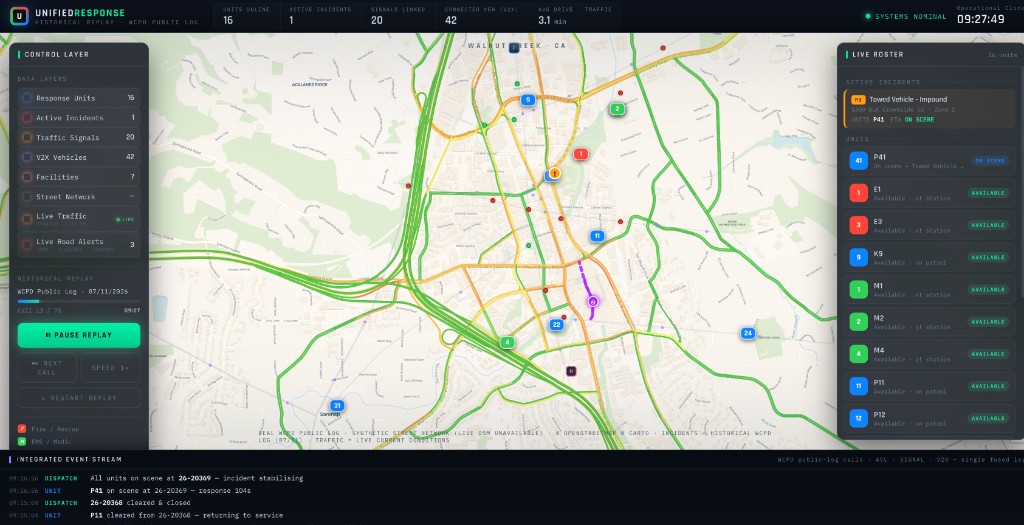
Live console — Walnut Creek, CA · real streets, real WCPD public-log calls, live traffic
conditions.
1
2
3
4
5
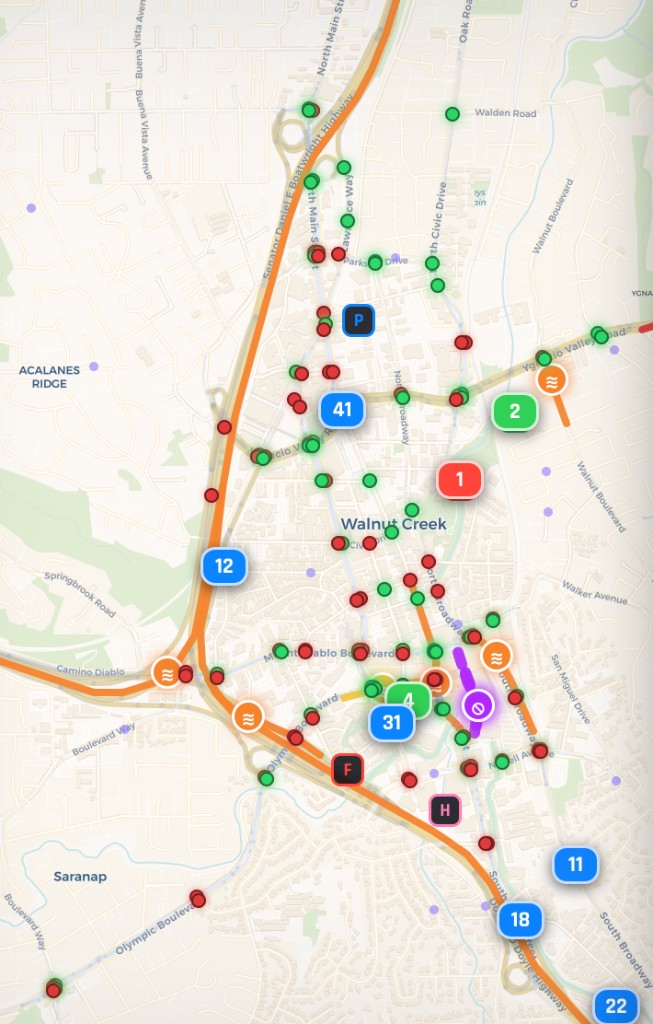
Every marker and colour on the map is a real operational object — all of it visible on the live map detail at right.
This sequence is what separates UnifiedResponse from a unit-tracking map — it runs automatically, in real time, the moment a priority call lands.
A CAD call for service is plotted with type, priority, and geocoded location on the live street network.
The closest available unit per required agency is dispatched and routed on the real road graph with live traffic weighting.
Signals along the route preempt to green; a SAE J2735 priority request goes out to connected vehicles in the corridor.
Every action is written to one shared event stream, giving all agencies a single synchronized picture.
The console is a live application, not a video. Everything you see is driven by real map data and a tick-based simulation engine — architected so each source becomes a production feed without a rewrite.
Real OpenStreetMap street and signal geometry for Walnut Creek loads at runtime, so shared intersections are true intersections and units route on the actual road network. In production this swaps to the city's own centerline GIS and signal inventory.
Today the incident layer replays the WCPD public daily-bulletin log — historical, publicly
available calls, geocoded to the map. In production this becomes the live CAD / 911 feed with no change to
the coordination logic.
Units move on a time-weighted shortest-path route over the street graph, with live traffic-aware routing layered on top. The synthetic unit roster swaps to live AVL / telematics feeds at the same interface.
Real-time congestion and road closures / jams stream in from live traffic tiles and incident
APIs and refresh continuously — the same real-world conditions drivers see right now.
Signal preemption and connected-vehicle yield run on standards-based messaging
(SAE J2735 BSM/SRM/SSM), ready to connect to real controller integrations and RSU / AV
networks.
Talk to us about a pilot in your jurisdiction and see the coordination layer running on your streets.